


1. What Are Database Statistics
Database statistics are metadata that the query optimizer uses to estimate the cost of different execution plans. These statistics include.
- Row counts in tables
- Distribution of values in columns
- Index cardinality
- Data density and selectivity
- NULL value frequencies
When these statistics become outdated (stale), the optimizer makes suboptimal decisions, leading to poor query performance.
2. Stale Statistics in PostgreSQL
2.1.How Statistics Affect Execution Plans
How Statistics Affect Execution Plans
PostgreSQL's query planner uses statistics from the pg_statistic table to create efficient execution plans. When statistics are stale, the planner may.
- Choose nested loop join when hash join would be better
- Estimate far fewer rows than actually returned
- Use wrong index or no index at all
- Allocate insufficient memory for operations
2.2.Detect Stale Statistics
Detect Stale Statistics
2.2.1.Check the pg_stat_all_tables view
Check the pg_stat_all_tables view
Key indicators.
-
n_mod_since_analyze- rows modified since last analysis -
n_live_tup- current live row count -
Large
n_dead_tupcombined with no recentVACUUMsuggests stale stats
When to worry.
-
n_mod_since_analyze> 10% ofn_live_tup(indicates significant data changes) -
last_analyzeis days or weeks old on frequently modified tables -
Query performance suddenly degrades without code changes
2.2.2.Compare execution plan with actual stats
Compare execution plan with actual stats
Problem. Planner estimated 50 rows but actually there are 350 rows.
Why. Statistics are stale, the Session table has 2,770 modifications since last analyze (44 days ago). User session distribution has changed significantly since last ANALYZE.
Impact.
- Planner might choose nested loop join expecting small result set
- Allocated memory might be insufficient
- Query takes significantly longer than it should
- If this query is used in joins, the entire execution plan could be suboptimal
Solution.
After running ANALYZE, check the plan again.
Much better! The estimate is now close to the actual count (345 vs 350).
2.3.Common Solutions in PostgreSQL
Common Solutions in PostgreSQL
2.3.1.Manual ANALYZE
Manual ANALYZE
2.3.2.Configure Autovacuum
Configure Autovacuum
Recommended settings for high-traffic tables:
-
autovacuum_analyze_scale_factor = 0.05(5% threshold instead of default 10%) -
autovacuum_analyze_threshold = 500(lower threshold for more frequent updates)
2.4.Interpret Real Statistic Results
Interpret Real Statistic Results
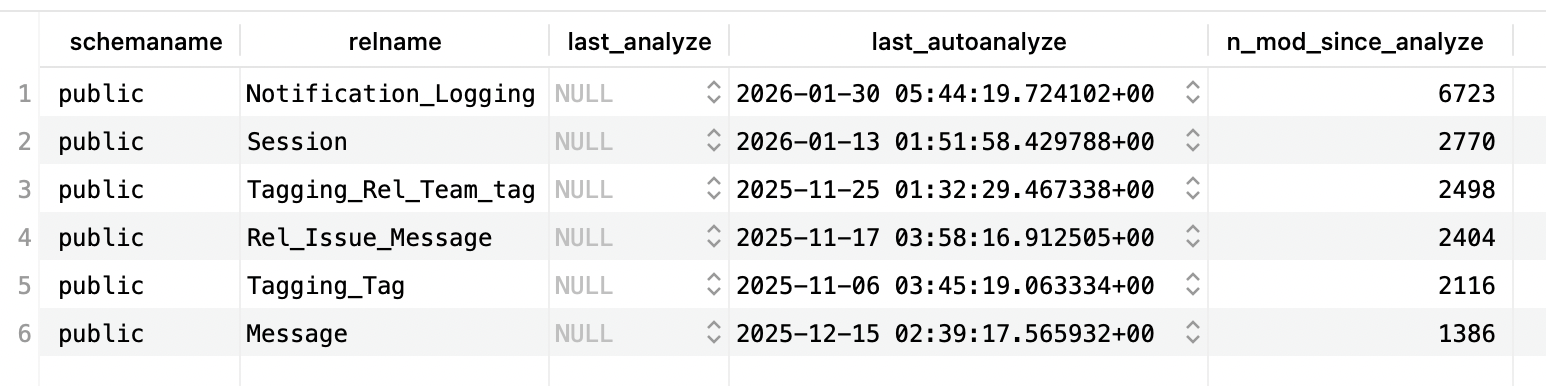
The analysis is as follows:
Notification_Logging
- 6,723 modifications since last analyze (most active table)
- Last analyzed 27 days ago (2026-01-30)
- Action needed. Run
ANALYZE Notification_Logging;- high write activity suggests stale distribution statistics
Session
- 2,770 modifications since last analyze
- Last analyzed 44 days ago (2026-01-13)
- Consider action. Depending on table size, this could be significant (e.g., if table has only 5,000 rows, this is 55% changed!)
Tagging_Rel_Team_tag (Stale)
- 2,498 modifications since last analyze
- Last analyzed 93 days ago (2025-11-25) - over 3 months!
- Action needed. Run
ANALYZE Tagging_Rel_Team_tag;- statistics are definitely stale
Rel_Issue_Message (Very Stale)
- 2,404 modifications since last analyze
- Last analyzed 101 days ago (2025-11-17) - over 3 months!
- Action needed. Run
ANALYZE Rel_Issue_Message;immediately
Tagging_Tag (Extremely Stale)
- 2,116 modifications since last analyze
- Last analyzed 112 days ago (2025-11-06) - nearly 4 months!
- Action needed. Run
ANALYZE Tagging_Tag;immediately - optimizer likely making poor decisions
Message (Moderately Stale)
- 1,386 modifications since last analyze
- Last analyzed 73 days ago (2025-12-15) - over 2 months
- Action recommended. Run
ANALYZE Message;- statistics likely outdated
Overall assessment:
- All tables show modifications without recent manual analysis (
last_analyzeis NULL) - Autovacuum has run, but may not be frequent enough
- The oldest statistics (Tagging_Tag, Rel_Issue_Message) are 3-4 months old
- Immediate action: Run
ANALYZEon all tables, especially the older ones - Long-term fix: Adjust autovacuum settings to analyze more frequently
3. Stale Statistics in Oracle Database
3.1.How Statistics Affect Execution Plans
How Statistics Affect Execution Plans
Oracle's Cost-Based Optimizer (CBO) relies on statistics stored in the data dictionary. Stale statistics can lead to.
- Wrong join order selection
- Incorrect decision between index scan and full table scan
- Poor cardinality estimates
- Suboptimal partition pruning
3.2.Detecting Stale Statistics
Detecting Stale Statistics
3.2.1.Check DBA_TAB_STATISTICS
Check DBA_TAB_STATISTICS
Key indicators.
stale_stats = 'YES'- Oracle automatically marks statistics as stale when > 10% of rows changelast_analyzedshows when statistics were last gatherednum_rows = NULLmeans statistics have never been gathered
3.2.2.Query execution plan analysis
Query execution plan analysis
Look for:
- Large discrepancy between estimated rows and actual rows
- Full table scans where index scans should be used
- Hash joins where nested loops would be better (or vice versa)
3.3.Solutions in Oracle Database
Solutions in Oracle Database
3.3.1.Oracle's Schema Ownership Model
Oracle's Schema Ownership Model
In oracle we are also able to update the statistic, but to understand the parameters used in that SQL command, we need to understand the models in Oracle database.
In Oracle, each user is also a schema.
Oracle model.
PostgreSQL model (for comparison).
Key differences.
| Aspect | Oracle | PostgreSQL |
|---|---|---|
| Schema creation | Automatic (when user created) | Explicit (CREATE SCHEMA) |
| Schema ownership | One schema = one user owns ALL objects in it | Multiple users can own different tables in the same schema |
| Naming | Schema name = User name | Schema names independent of users |
| Schema vs User | Same entity (1-to-1) | Different entities (many-to-many) |
| Object ownership | All objects in schema owned by schema's user | Different users can own different objects in same schema |
Simply put:
-
In oracle all tables belong to the schema = user.
-
While in other database such as PostgreSQL, tables still belong to one schema, but different users can own different tables in that schema
Therefore before we can remove a user, we need to transfer the owner of that table to other user first, usually the
pgadminuser (again, in pgsql, role = user)).
Oracle Statistics Collection Context.
When we use DBMS_STATS.GATHER_SCHEMA_STATS:
What ownname really means in Oracle:
ownname= Schema name = Owner name (all the same thing!)- It's not asking "who owns the tables" (the schema always owns its own tables)
- It's asking "which schema (user's namespace) should we analyze?"
Example with multiple users/schemas:
Question. Why the parameter is called
ownname?
Historical naming - in Oracle's implementation, the "owner" of all objects in a schema is the user that the schema belongs to. Since schema = user in Oracle, the parameter name ownname essentially means "which user's schema".
PostgreSQL equivalent (for comparison).
Summary.
- In Oracle:
ownname= schema name = user name (all same) - In PostgreSQL: user ≠ schema (different users can own tables in same schema)
- Oracle's
DBMS_STATS.GATHER_SCHEMA_STATS('SALES_USER')means "gather stats for all tables in the SALES_USER schema" - PostgreSQL's
ANALYZE sales_schemaupdates stats for all tables in that schema, regardless of who owns them
3.3.2.Manual Statistics Gathering
Manual Statistics Gathering
3.3.3.Understanding GATHER Command Options
Understanding GATHER Command Options
Oracle provides different gathering strategies through the options parameter.
Available options.
Option values.
| Option | Description | When to Use |
|---|---|---|
GATHER | Gather stats even if not stale | After major data changes |
GATHER STALE | Only gather if marked stale | Regular maintenance |
GATHER EMPTY | Only gather if no stats exist | New tables only |
GATHER AUTO | Oracle decides based on staleness | Recommended default |
Decision guide for choosing the right option:
3.3.4.Understand the different GATHER commands
Understand the different GATHER commands
Three GATHER commands serve different purposes:
| Command | Description |
|---|---|
GATHER_TABLE_STATS | Purpose. Update statistics for one specific table When to use. One table has stale statistics, after large data changes to a single table, quick targeted fix Duration. Seconds to minutes (one table only) |
GATHER_SCHEMA_STATS | Purpose. Update statistics for all tables in a schema at once When to use. Multiple tables are stale, after bulk data load affecting many tables, regular maintenance Duration. Minutes to hours (depends on schema size) Note. Automatically gathers stats for all tables, so we don't need individual GATHER_TABLE_STATS for each table |
GATHER_SYSTEM_STATS | Purpose. Collects hardware performance metrics (CPU speed, I/O throughput, disk latency) When to use. Once after hardware changes or database migration, helps optimizer understand system capabilities Duration. Hours (needs workload sampling) Note. This is NOT about table statistics - it's about hardware performance characteristics |
Examples for different scenarios.
3.3.5.Configure Automatic Statistics Collection
Configure Automatic Statistics Collection
Oracle automatically gathers statistics during maintenance windows. We can check and configure.
3.3.6.Monitor Statistics History
Monitor Statistics History
4. Common Practices Across All Databases
4.1.Regular Maintenance Schedule
Regular Maintenance Schedule
- PostgreSQL. Enable autovacuum and schedule periodic manual ANALYZE during maintenance windows
- Oracle. Use automatic statistics collection and supplement with manual gathering after large data changes
4.2.Monitor After Bulk Operations
Monitor After Bulk Operations
All databases require statistics updates after.
- Large
INSERT/UPDATE/DELETEoperations - Data imports or migrations
- Index creation or modification
- Schema changes
4.3.Test Query Plans
Test Query Plans
Always verify execution plans in development before deploying.
4.4.Set Up Alerts
Set Up Alerts
Monitor for performance degradation that might indicate stale statistics:
- Sudden increases in query execution time
- Changes in execution plan choices
- Resource utilization spikes
4.4.1.PostgreSQL alert setup
PostgreSQL alert setup
4.4.2.Oracle alert setup
Oracle alert setup
Generic monitoring approach (all databases):