MongoDB automatically invalidates cached query plans after approximately 1,000 write operations (inserts, updates, deletes) on a collection. This means.
Statistics effectively "reset" every ~1,000 writes
High-write-volume collections get fresh plans more frequently
1{2"executionStats":{3"nReturned":100,// Rows returned to client4"totalDocsExamined":50000,// Rows scanned5"executionTimeMillis":1523,6"executionStages":{7"stage":"COLLSCAN"// Collection scan instead of index!8}9}10}
3.6.
Red flags indicating stale statistics or poor index usage
3.6.1.
High examination ratio (totalDocsExamined / nReturned > 10)
3.6.1.1.
On B-tree
Misconception. High examination ratio is inevitable because we filter documents with WHERE clauses first, then return results.
This is wrong, with proper indexes, the database uses the index to identify matching documents BEFORE examining them. The index is the filter mechanism.
Misconception. But don't I need to scan all rows to check the WHERE condition?
No! This is the entire purpose of indexes - to avoid scanning all rows.
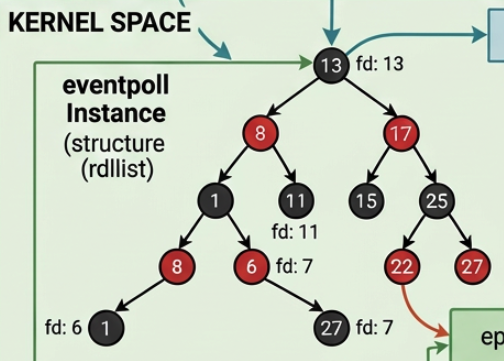
How B-tree indexes eliminate full scans:
Think of an index like a phone book:
Without index (full scan): To find "John Smith", open EVERY page and check EVERY name (scan all 1 million entries)
With index (B-tree): Jump to the "S" section → Jump to "Sm" → Jump to "Smith, John" (check ~log₂(1M) ≈ 20 entries)
3.6.1.2.
Detailed example on how the B-tree structure works
1// Collection has 1,000,000 users2// We want: status = "active"3// Only 1,000 users are "active"45// WITHOUT INDEX - Must scan everything:6db.users.find({status:"active"})78// Physical process WITHOUT index:9// 1. Start at first document on disk10// 2. Read document #1, check status → "inactive" → skip11// 3. Read document #2, check status → "pending" → skip12// 4. Read document #3, check status → "active" → keep!13// 5. Read document #4, check status → "inactive" → skip14// ... repeat for ALL 1,000,000 documents!15// Total reads: 1,000,000 documents from disk16// Time: ~10+ seconds
Now let's see what happens with an index:
1// CREATE INDEX - builds this B-tree structure:2db.users.createIndex({status:1})34// Index creates a separate sorted tree structure:5/*
6B-tree Index on "status" field:
7 [Root Node]
8 / \
9 ["active"] ["inactive", "pending"]
10 / / \
11 [Doc IDs: 5, 12, [Doc IDs: [Doc IDs:
12 23, 45, 78, 1, 2, 3, 999,997,
13 ... 1000 IDs] ... 500k IDs] ... 499k IDs]
1415The index stores:
16- Sorted keys ("active", "inactive", "pending")
17- Document IDs/pointers for each key value
18- Tree structure for fast lookup (log N time)
19*/2021// Now query WITH index:22db.users.find({status:"active"})2324// Physical process WITH index:25// 1. Look at root node of B-tree (1 read)26// 2. Compare "active" < root → go left branch (1 read)27// 3. Found "active" node → contains list of 1,000 document IDs28// 4. Read only those 1,000 documents by ID from disk29// Total reads: ~3 index nodes + 1,000 documents = 1,003 reads30// Time: ~10 milliseconds3132// Result:33// WITHOUT index: Read 1,000,000 docs, examined 1,000,000, returned 1,000 (1000x ratio)34// WITH index: Read 1,000 docs, examined 1,000, returned 1,000 (1.0x ratio)
Question. Why we DON'T need to scan all rows with an index?
The B-tree index is a pre-sorted lookup table that was built when we created the index:
1// When we run: db.users.createIndex({ status: 1 })2// MongoDB builds this mapping (simplified):34Index structure:5{6"active":[5,12,23,45,78,...1000documentIDs],7"inactive":[1,2,3,4,6,...500,000documentIDs],8"pending":[7,8,9,...499,000documentIDs]9}1011// When we query: db.users.find({ status: "active" })12// MongoDB does NOT scan the collection!13// Instead:14// 1. Look up "active" in the pre-built index → Found! [5, 12, 23, ...]15// 2. Jump directly to documents 5, 12, 23, ... on disk16// 3. Return those specific documents
The key difference:
Full scan: Check condition on every row in the table
Index scan: Check condition in the index only (which is sorted and tiny), then fetch only matching rows
3.6.1.3.
Performance comparison
Operation
Without Index
With Index
Improvement
Data structures accessed
Main table only
Index tree + specific docs
Separate lookup structure
Comparisons needed
1,000,000
~20 (tree depth) + 1,000
1000x fewer
Documents read from disk
1,000,000
1,000
Read only matches
Time complexity
linear
= matching docs
Actual time
10+ s
10 ms
1000x faster
totalDocsExamined
1,000,000
1,000
Only matching docs
Examination ratio
1000x
1.0x
Perfect efficiency
Let's answer the following question:
Question. Do we need to scan all rows to check the WHERE condition?
No! The index is a pre-built answer to our WHERE condition.
When we create an index, MongoDB:
Scans all rows ONCE during index creation
Builds a sorted structure (B-tree) with the answer
Maintains it as data changes
When we query:
Look up in the pre-built answer (the index)
Get document IDs instantly (no scanning needed)
Fetch only those specific documents
Think of it as: "Scanning is done at index creation time, not at query time."
3.6.1.4.
When high examination ratio is acceptable
1// Multikey indexes on arrays may have slight overhead2db.collection.find({"tags":"urgent","status":"active"})
Why multikey indexes examine more documents:
Given these documents:
1{_id:1,tags:["urgent","bug"],status:"active"}// Match2{_id:2,tags:["urgent","feature"],status:"closed"}// Has "urgent" but wrong status3{_id:3,tags:["urgent","docs"],status:"active"}// Match4{_id:4,tags:["urgent","test"],status:"pending"}// Has "urgent" but wrong status
With compound index on {tags: 1, status: 1}:
Index lookup: Find all entries where tags = "urgent" (using index) → finds 4 documents
Document examination: MongoDB must fetch and check each document's status field
Doc 1: urgent + active → return
Doc 2: urgent + closed → examined but not returned
Doc 3: urgent + active → return
Doc 4: urgent + pending → examined but not returned
Result:
nReturned: 2 (docs 1 and 3)
totalDocsExamined: 4 (all documents with "urgent")
Ratio: 2x (examined 4, returned 2)
Why this is acceptable:
Still used an index (IXSCAN, not COLLSCAN)
Only examined 4 documents, not the entire collection (could be 50,000 docs)
The overhead is due to legitimate index matches that failed secondary predicates
Much faster than scanning all documents without an index
Acceptable ratio: 1.5x - 3x for multikey/compound indexes with multiple predicates
3.6.1.5.
When high ratio indicates a problem
1// No index exists - must scan everything2nReturned:1003totalDocsExamined:50,0004stage:"COLLSCAN"5// Problem: Missing index, add one!67// Wrong index chosen due to stale statistics8nReturned:1009totalDocsExamined:50,00010stage:"IXSCAN"11indexName:"wrong_index"12// Problem: Optimizer chose poorly selective index13// Solution: Update statistics or hint correct index1415// Index exists but has poor selectivity16nReturned:117totalDocsExamined:10,00018stage:"IXSCAN"19indexName:"status_1"20// Problem: Index not selective enough (e.g., status has only 2 values)21// Solution: Create compound index with more selective fields
3.6.2.
Collection scans (stage: COLLSCAN) when an index should exist
This is the PRIMARY indicator. If we see COLLSCAN:
No index exists on filtered fields, OR
Optimizer determined full scan is cheaper (table too small, or query returns >30% of data)
1// Expected COLLSCAN (acceptable):2db.smallCollection.find({})// Fetching all documents3// Collection has 100 documents - full scan is efficient45// Problematic COLLSCAN:6db.largeCollection.find({userId:"12345"})// Should use index7// Collection has 10M documents - needs index on userId!
3.6.3.
Wrong index chosen (indexName shows unexpected index)
Even with IXSCAN, the optimizer might choose the wrong index due to stale statistics:
1// Expected: Use compound index { userId: 1, timestamp: 1 }2// Actual: Used index { timestamp: 1 } - less selective3stage:"IXSCAN"4indexName:"timestamp_1"5totalDocsExamined:50,000// High ratio despite using index!6nReturned:10
Question. When does the optimizer choose the wrong index?
The query optimizer uses statistics to estimate how many documents each index will need to examine (this estimate is called cardinality). It chooses the index with the lowest estimated cost.
3.6.3.1.
Scenario 1: Stale statistics cause wrong index selection
Consider a users collection with 1,000,000 documents and two indexes:
Old stats say: 50% premium users (500K), 30% USA users (300K)
Optimizer estimates: Index A scans 500K, Index C scans 300K
Choice: Index C (lower estimate)
Actual current data:
Reality: 10% premium users (100K), 80% USA users (800K)
If optimizer knew this: Index A scans 100K, Index C scans 800K
Should have chosen: Index A (much better!)
Result with wrong index choice:
1stage:"IXSCAN"2indexName:"country_1"// Wrong index!3totalDocsExamined:800,000// Scans most USA users4docsReturned:8,000// Only 10% of USA users are premium5// Examination ratio: 800,000 / 8,000 = 100x inefficiency!
3.6.3.3.
Summary to two scanerios
Why this happens.
Statistics capture data distribution at a point in time
Data changes (inserts, updates, deletes skew distribution)
Optimizer uses OLD cardinality estimates to calculate index costs
Wrong index appears cheaper based on outdated information
Query uses IXSCAN but examines many irrelevant documents
MongoDB vs SQL databases (same behavior). This is NOT unique to MongoDB, major databases (such as PostgreSQL, MySQL, Oracle, SQL Server) have the same issue. They all:
Use B-tree indexes (same data structure)
Rely on statistics for query planning
Need periodic statistics updates to maintain optimal plans
Can choose wrong indexes when statistics are stale
The index mechanics work identically - the problem is the optimizer's decision-making based on outdated information, not the index structure itself.
How to fix. Force the optimizer to use the correct index. When stale statistics cause wrong index selection, we have several solutions:
Solution 1 (Update statistics, a permanent fix). MongoDB automatically maintains statistics, but we can force a refresh:
1// Option 1: Reindex the collection (updates statistics)2db.users.reIndex()34// Option 2: Run validate command (repairs and updates stats)5db.runCommand({validate:"users",full:true})67// Option 3: Drop and recreate problematic index8db.users.dropIndex("country_1")9db.users.createIndex({country:1})
Solution 2 (Use index hints, a temporary workaround). Force the query to use a specific index:
1// Force use of status index2db.users.find({status:"premium",country:"USA"})3.hint({status:1})45// Alternative: Force by index name6db.users.find({status:"premium",country:"USA"})7.hint("status_1")89// Verify it uses the correct index10db.users.find({status:"premium",country:"USA"})11.hint({status:1})12.explain("executionStats")
Solution 3 (Create compound index, a long-term solution). If queries frequently filter on multiple fields:
1// Create compound index2db.users.createIndex({status:1,country:1})34// Now this query will efficiently use the compound index5db.users.find({status:"premium",country:"USA"})6// Uses status first (10% selectivity) then country (eliminates most remaining)
Solution 4 (Rewrite query). Sometimes restructuring the query helps:
1// Original problematic query2db.users.find({status:"premium",country:"USA"})34// Alternative: Use aggregation with explicit pipeline5db.users.aggregate([6{$match:{status:"premium"}},// Use status index first7{$match:{country:"USA"}}// Then filter by country8])
Verification. Confirm the fix worked, after applying any solution, verify using explain():
First: Check stage - is it COLLSCAN or IXSCAN?
- COLLSCAN → Need to create index (see 〈5. Performance Improvement Strategies〉)
- IXSCAN → Continue to next check
1{2_id:ObjectId,3messagesSessionId:String,4success:Boolean,5result:[// Large array with 70+ subdocuments6{7issueId:String,8summaryUuid:String,9groupID:Number,10lang:String,11title:String,12summary:String,13originalScripts:Array,14imgUrls:Array,15assignee:Array,16topic:Array,17location:Array,18// ... many more fields19}20]21}
4.1.
Baseline: Optimal Query Performance
Before examining slow queries, let's see what optimal performance looks like:
1winningPlan:{2isCached:false,3stage:'EXPRESS_IXSCAN',// Optimized index scan (MongoDB 8.0+)4keyPattern:'{ _id: 1 }',5indexName:'_id_'6}7rejectedPlans:[]// No alternative plans considered
Resource Usage.
1operationMetrics:{2docBytesRead:68251,// ~68KB document size3idxEntryBytesRead:14,// Only 14 bytes read from index4cpuNanos:155102// ~155 microseconds CPU time5}
What makes this optimal:
Perfect index utilization. Index lookup required only 14 bytes, found exact document pointer immediately
Optimal execution path. No rejected plans, no caching overhead, zero optimization time
No stale statistics concerns. Direct _id lookup always uses primary index, no cardinality estimation needed
This is what we aim for because:
Examination ratio of 1.0x (perfect selectivity)
Sub-millisecond execution
Appropriate index usage
No wasted scans
Now let's contrast this with problematic query patterns:
1// Query: Find all documents where any result has a specific assignee2db.llmsummaries.find({3"result.assignee.userId":"5febb417-3f38-4894-8388-6f79585a5b72"4}).explain("executionStats")
For each document, traverse the nested result array
Check each assignee array element within each result
No index on result.assignee.userId to shortcut this process
4.2.2.
Example 2: Complex Text Search in Nested Documents
1// Query: Search for keywords in summaries within result array2db.llmsummaries.find({3"result.summary":{$regex:/floor height|elevation/i}4}).explain("executionStats")
MongoDB evaluates regex pattern against every summary field in every result array
With ~70 result elements per document: 6,319 docs × 70 elements = ~442,330 string matches!
Pattern has alternation (|) requiring two substring checks per field
No short-circuit: must scan entire collection even after finding matches
4.2.3.
Example 3: Multiple Array Element Matching
1// Query: Find sessions with specific topic AND location2db.llmsummaries.find({3"result":{4$elemMatch:{5"topic.name":"FLOORING",6"location.detail":"2F"7}8}9}).explain("executionStats")
Compound condition overhead: MongoDB evaluates both topic.name = "FLOORING" AND location.detail = "2F" for each result element
Nested array scanning: With ~70 result elements per document: 6,319 docs × 70 = ~442,330 array element checks
No early termination: Even though no matches found, must scan entire collection to confirm
Double nested arrays: Both topic and location are arrays within result array (triple nesting!)
$elemMatch semantics: Requires finding single array element matching ALL conditions - more complex than separate filters
4.2.4.
Example 4: Aggregation Counting Array Elements
1// Query: Count total issues by groupID across all sessions2db.llmsummaries.aggregate([3{$unwind:"$result"},4{$group:{_id:"$result.groupID",count:{$sum:1}}},5{$sort:{count:-1}}6])
$unwind: Expands 6,319 documents into 12,920 documents (2.04x expansion)
$group: Aggregates 12,920 unwound documents into 124 unique groups
$sort: Sorts 124 groups in memory by count descending
Performance analysis:
Metric
Value
Impact
Document expansion
2.04x more than input
12,920 unwound from 6,319 input
Array size
~2 elements on average
Per result array
Execution time
638ms
For processing 12,920 unwound documents
Memory usage
Memory-intensive operation
All grouping and sorting in RAM
Memory limits
Without allowDiskUse: true
Large result sets could exceed limits
Why this is slow:
No index can help, aggregation pipelines that start with $unwind must perform full collection scan (COLLSCAN) to access all documents
Array unwinding creates intermediate result set 2x larger than input
Grouping and sorting operations consume significant memory
For larger arrays or collections, execution time grows linearly with total unwound documents
4.2.5.
Example 5: Date Range Query on Nested Timestamps
1// Query: Find sessions with results between date range2db.llmsummaries.find({3"result.issueCreatedAt":{4$gte:NumberLong("1756086000000"),5$lte:NumberLong("1756090000000")6}7}).explain("executionStats")
1// Create multikey index on nested array field2db.llmsummaries.createIndex({3"result.assignee.userId":14})56// After index creation, the query should show:7// - stage: 'IXSCAN' instead of 'COLLSCAN'8// - totalKeysExamined: ~3 (only matching documents)9// - totalDocsExamined: 3 (exact matches only)10// - executionTimeMillis: <5ms (instead of 148ms)11// - Efficiency ratio: 1.0x (instead of 2106x)
Expected improvement:
Before index: 148ms, examined 6,319 docs, read 22MB
After index: <5ms, examined 3 docs, read ~40KB
Speedup: 30-50x faster
Resource savings: 99.95% less data read
5.1.2.
For compound queries on arrays
1// Create compound index for multiple common filters2db.llmsummaries.createIndex({3"result.assignee.userId":1,4"result.groupID":15})67// Or denormalize if queries are critical8// Move frequently-queried array elements to root level
1// Create text index on summary fields2db.llmsummaries.createIndex({3"result.summary":"text",4"result.title":"text"5})67// Query with text index (replaces regex)8db.llmsummaries.find({9$text:{$search:"floor height elevation"}10})1112// After text index creation, the query should show:13// - stage: 'TEXT' instead of 'COLLSCAN'14// - Uses inverted index for efficient word matching15// - No case-sensitivity overhead (text indexes are case-insensitive by default)16// - executionTimeMillis: <10ms (instead of 24ms)17// - Efficiency ratio: Much closer to 1.0x
Expected improvement:
Before text index: 24ms, examined 6,319 docs, ~442,330 regex operations
After text index: <10ms, examined only matching docs, efficient word lookup
Speedup: 2-5x faster
Note: Text indexes work with $text operator, not $regex
Alternative for regex patterns:
1// If regex is required, consider filtering first2db.llmsummaries.find({3success:true,// Filter on indexed field first4"result.summary":{$regex:/floor height|elevation/i}5})67// Or store commonly searched terms separately8db.llmsummaries.createIndex({"result.keywords":1})
1// Option 1: Create compound multikey index2db.llmsummaries.createIndex({3"result.topic.name":1,4"result.location.detail":15})67// Query remains the same - optimizer will use compound index8db.llmsummaries.find({9"result":{10$elemMatch:{11"topic.name":"FLOORING",12"location.detail":"2F"13}14}15})1617// After compound index creation, the query should show:18// - stage: 'IXSCAN' instead of 'COLLSCAN'19// - totalKeysExamined: varies based on selectivity20// - executionTimeMillis: <5ms (instead of 10ms)21// - Can short-circuit when no matches exist
Expected improvement:
Before index: 10ms, examined all 6,319 docs, read 22MB, 0 results
After compound index: <5ms, examined only candidate docs, early termination
Speedup: 2-3x faster even for non-matching queries
Resource savings: 95%+ less data read when matches exist
Alternative: Denormalize for critical queries
1// If this query pattern is frequent, denormalize to root level2// Add aggregated fields during document creation:3{4_id:ObjectId,5messagesSessionId:String,6hasFlooring2F:Boolean,// Pre-computed flag7topicLocations:[// Flattened combinations8{topic:"FLOORING",location:"2F"}9],10result:[/* original nested data */]11}1213// Query becomes simple and fast:14db.llmsummaries.find({hasFlooring2F:true})15// Or with index on topicLocations:16db.llmsummaries.find({17topicLocations:{$elemMatch:{topic:"FLOORING",location:"2F"}}18})
1// Create index on nested date field2db.llmsummaries.createIndex({3"result.issueCreatedAt":14})56// Query remains the same - optimizer will use index for range scan7db.llmsummaries.find({8"result.issueCreatedAt":{9$gte:NumberLong("1756086000000"),10$lte:NumberLong("1756090000000")11}12})1314// After index creation, the query should show:15// - stage: 'IXSCAN' instead of 'COLLSCAN'16// - Uses B-tree range scan to quickly locate matching documents17// - executionTimeMillis: <5ms (instead of 10ms)18// - Efficiency ratio: Much closer to 1.0x (instead of 6319x!)
Expected improvement:
Before index: 10ms, examined 6,319 docs, read 22MB, 1 result
After index: <5ms, examined only docs within date range, minimal reads
Speedup: 2-5x faster for typical date range queries
Resource savings: 99%+ less data scanned
Alternative: Denormalize for frequent date queries
1// If date range queries are critical, add indexed date field at root level2{3_id:ObjectId,4messagesSessionId:String,5earliestIssueDate:NumberLong,// Min date from result array6latestIssueDate:NumberLong,// Max date from result array7result:[/* original nested data with issueCreatedAt */]8}910// Create simple index (faster than multikey index)11db.llmsummaries.createIndex({12earliestIssueDate:1,13latestIssueDate:114})1516// Query becomes more efficient:17db.llmsummaries.find({18earliestIssueDate:{$lte:NumberLong("1756090000000")},19latestIssueDate:{$gte:NumberLong("1756086000000")}20})
1// Option 1: Add $match before $unwind to reduce documents processed2db.llmsummaries.aggregate([3{$match:{success:true,messagesSessionId:{ $in: relevantSessions }}},// Filter early4{$project:{result:1}},// Project only needed fields5{$unwind:"$result"},6{$group:{_id:"$result.groupID",count:{$sum:1}}},7{$sort:{count:-1}}8],{allowDiskUse:true})910// Option 2: Use $facet to run multiple aggregations efficiently11db.llmsummaries.aggregate([12{13$facet:{14groupCounts:[15{$unwind:"$result"},16{$group:{_id:"$result.groupID",count:{$sum:1}}},17{$sort:{count:-1}}18],19totalDocs:[20{$count:"total"}21]22}23}24])
Expected improvement:
Current performance: 638ms, 6,319 input → 12,920 unwound (2.04x expansion)
With $match filter: Reduces input document set, proportionally faster
With allowDiskUse: Prevents memory errors for larger result sets
Note: Indexes cannot optimize $unwind operations, but can speed up initial $match
Alternative. Pre-aggregate during data ingestion
1// If groupID counts are critical, maintain them at document level2{3_id:ObjectId,4messagesSessionId:String,5groupCounts:{// Pre-computed aggregation6"group1":3,7"group2":58},9result:[/* original nested data */]10}1112// Query becomes a simple find + aggregation13db.llmsummaries.aggregate([14{$project:{groupCounts:{$objectToArray:"$groupCounts"}}},15{$unwind:"$groupCounts"},16{$group:{17_id:"$groupCounts.k",18totalCount:{$sum:"$groupCounts.v"}19}},20{$sort:{totalCount:-1}}21])2223// Or use materialized views for real-time aggregations24db.createView(25"groupCountsView",26"llmsummaries",27[28{$unwind:"$result"},29{$group:{_id:"$result.groupID",count:{$sum:1}}},30{$sort:{count:-1}}31]32)3334// Query the view with $merge for incremental updates
Expected improvement with pre-aggregation:
Before: 638ms processing 12,920 unwound documents
After: <50ms querying pre-computed counts from document root
Speedup: 10-15x faster
Trade-off: Additional storage and update complexity
1// Create separate indexes for each OR condition2db.llmsummaries.createIndex({3"result.priority.name":14})56db.llmsummaries.createIndex({7"result.sentiment.name":18})910// Query remains the same - optimizer will use index union11db.llmsummaries.find({12$or:[13{"result.priority.name":"URGENT"},14{"result.sentiment.name":"NEGATIVE"}15]16})1718// After index creation, the query should show:19// - Multiple index scans combined (index union)20// - Reduced documents examined (only candidates from each index)21// - executionTimeMillis: <10ms (instead of 15ms)22// - Better efficiency as collection grows
Expected improvement:
Before indexes: 15ms, examined 6,319 docs, 5.08x efficiency, read 22MB
After indexes: <10ms, examined only matching index entries, ~1.5-2x efficiency
Speedup: 1.5-2x faster
Scalability: Performance gain increases with collection size growth
Alternative: Denormalize with boolean flags
1// Add pre-computed flags at root level for frequent OR patterns2{3_id:ObjectId,4messagesSessionId:String,5hasUrgentPriority:Boolean,// Pre-computed flag6hasNegativeSentiment:Boolean,// Pre-computed flag7result:[/* original nested data */]8}910// Create simple indexes (non-multikey, faster)11db.llmsummaries.createIndex({hasUrgentPriority:1})12db.llmsummaries.createIndex({hasNegativeSentiment:1})1314// Query becomes much more efficient:15db.llmsummaries.find({16$or:[17{hasUrgentPriority:true},18{hasNegativeSentiment:true}19]20})
5.2.
Check index usage statistics
1db.collection.aggregate([{$indexStats:{}}])
Example output:
1{2name:'messagesSessionId_1',3key:{messagesSessionId:1},4accesses:{5ops:0,// ← Index operations count6since:ISODate("2026-02-24T16:17:27.004Z")// ← When counter started7}8}
What each field actually means:
ops Number of times this index was used since the since timestamp
since When the statistics counter started tracking (NOT last use time!)
Resets when: mongod restarts, index is rebuilt, replica member restarts
If since is recent (days/weeks ago) and ops: 0, not enough data yet
If since is old (months ago) and ops: 0, index is truly unused
What this CAN tell us:
Unused indexes - ops: 0 with old since date (>30 days) = definitely not used
Relatively unused indexes - Very low ops compared to other indexes
Which indexes are hot - High ops count indicates frequent use
What this CANNOT tell us:
Index selectivity or efficiency
Whether the index helps performance
If queries using the index are slow
If a different index would be better
Interpreting the results:
For the example output above:
1// If `since` is 2026-02-24 (2 days ago):2ops:0,since:2026-02-24// ← Too recent to conclude anything3// Could be: recently created, or mongod restarted45// If `since` is 2025-11-01 (3+ months ago):6ops:0,since:2025-11-01// ← Strong signal: index unused for months7// Safe to consider dropping (after testing!)89// If comparing indexes:10IndexA: ops:5000,since:2026-01-0111IndexB: ops:2,since:2026-01-01// ← Index B rarely used, investigate why
Action items:
Unused indexes (ops: 0 with old since) - Consider dropping to reduce write overhead
Low-use indexes - Verify they serve specific important queries
High-use indexes - Ensure they're properly sized and maintained
Important: Always test in non-production first! An index with ops: 0 might still be critical for a rare but important query (monthly reports, admin operations, etc.).
5.3.
Track index selectivity changes over time
The key to detecting stale plans is comparing query execution behavior before and after collection changes, not plan cache metadata.
What we need to track:
Index selectivity ratio - for each important query:
1// Run periodically and log results2const result = db.orders.find({status:"pending"}).explain("executionStats");3const selectivity = result.executionStats.nReturned/ result.executionStats.totalDocsExamined;4console.log(`Selectivity: ${selectivity}`);// Lower = worse
Execution time trends - same query taking longer?
1const result = db.orders.find({customerId:123}).explain("executionStats");2console.log(`Execution time: ${result.executionStats.executionTimeMillis}ms`);
Plan stability - is the same index being chosen?
1const result = db.orders.find({status:"pending"}).explain("executionStats");2console.log(`Winning plan: ${result.executionStats.executionStages.stage}`);3console.log(`Index used: ${result.executionStats.executionStages.indexName}`);
Tracking Flow:
Establish baseline explain() results for critical queries
Re-run same queries periodically to detect degradation
Compare totalDocsExamined / nReturned ratio over time
High ratio (scanning many docs, returning few) = likely stale plan
6. Fixing stale plan cache Problems when Indexes Already Exist in MongoDB
We will adopt solutions in this section when:
Indexes exist, but query performance suddenly degraded
explain() shows wrong index being used
Collection has grown significantly since plan was cached
Data distribution has changed (e.g., status field that was evenly distributed is now 99% "archived")
Collection scans on unindexed queries (create indexes first)
Query patterns that inherently need to scan many documents
6.1.
Clear Plan Cache
Self-hosted MongoDB:
1// Clear all cached plans for a collection2db.collection.getPlanCache().clear()34// Clear specific query shape5db.collection.getPlanCache().clearPlansByQuery(6{field: value },7{ projection },8{ sort }9)
MongoDB Atlas:
1// Direct plan cache clearing not available in Atlas2// Atlas manages plan cache automatically34// Alternative: Force plan re-evaluation by:5// 1. Adding/modifying an index (triggers cache invalidation)6// 2. Waiting for automatic invalidation (~1000 writes)7// 3. Using hints to override cached plan selection89// Example: Rebuild index to clear related plans10db.collection.dropIndex("index_name")11db.collection.createIndex({field:1},{name:"index_name"})
6.2.
Rebuild Indexes
1// Rebuild specific index2db.collection.reIndex()34// Drop and recreate index to update statistics5db.collection.dropIndex("index_name")6db.collection.createIndex({field:1})
6.3.
Use Index Hints
1// Force specific index usage2db.collection.find({field: value }).hint({field:1})34// Force collection scan5db.collection.find({field: value }).hint({$natural:1})
6.4.
Analyze Query Performance
1// Get detailed execution statistics2db.collection.find({field: value }).explain("executionStats")34// Monitor slow queries5db.setProfilingLevel(2)// Profile all operations6db.system.profile.find().limit(10).sort({ts:-1})
6.5.
Configure Plan Cache Settings
Self-hosted MongoDB 5.0+:
1// Plan cache is managed automatically2// But we can influence it through query settings34// Set query settings for specific operations5db.adminCommand({6setQuerySettings:{7filter:{field:{$eq:"value"}},8settings:{9indexHints:{allowedIndexes:["index_name"]}10}11}12})
MongoDB Atlas approach:
Use Performance Advisor. Atlas automatically suggests indexes and identifies slow queries
Enable Profiling. Set profiling level via Atlas UI (Cluster → Configuration → Additional Settings)
Monitor Metrics. Track query efficiency through Atlas monitoring dashboard
Create Alerts. Set up alerts for high query execution times or scan ratios
Use Query Profiler. Analyze historical query performance in Atlas UI
The JSON configuration format shown below represents the Atlas alert structure. These values correspond to what we enter in the UI or send via API:
1// ALERT CONFIGURATION EXAMPLES2// These are the settings we configure (via UI, API, or Terraform)34// 1. Query Efficiency Alert (Detects inefficient queries)5// WHERE: Atlas UI → Alerts → Add Alert → "Query Targeting: Scanned Objects / Returned"6// OR: Use in REST API request body7// OR: Use in Terraform resource definition8{9eventTypeName:"QUERY_TARGETING_SCANNED_OBJECTS_PER_RETURNED",10threshold:1000,// Alert if scanned/returned ratio > 100011operator:"GREATER_THAN"12}13// What it does: Monitors the ratio of documents scanned vs documents returned14// Why it matters: High ratio (e.g., 1000x) means query is examining 1000 docs to return 115// Example: If this fires, we are likely seeing the problems in Examples 1-5 (2106x, 6319x inefficiency)16// Real-world: Would have caught Example 5 (6319x) and Example 1 (2106x)1718// 2. Slow Query Alert (Detects long-running queries)19// WHERE: Atlas UI → Alerts → Add Alert → "Query Execution Time"20// OR: Use in REST API / Terraform with this configuration21{22eventTypeName:"QUERY_EXECUTION_TIME",23threshold:100,// Alert if query takes > 100ms24operator:"GREATER_THAN"25}26// What it does: Triggers when any query takes longer than threshold (in milliseconds)27// Why it matters: Indicates missing indexes, stale statistics, or inefficient operations28// Example: Would catch Example 1 (148ms) and Example 4 aggregation (638ms)29// Real-world: Would have caught Example 4 (638ms aggregation)3031// 3. Collection Scan Alert (Detects full table scans)32// WHERE: Atlas UI → Alerts → Add Alert → "Collection Scans"33// OR: Use in REST API / Terraform with this configuration34{35eventTypeName:"COLLSCANS",36threshold:100,// Alert if > 100 collection scans per minute37operator:"GREATER_THAN"38}39// What it does: Counts how many COLLSCAN operations happen per time window40// Why it matters: COLLSCAN means no index used - reading entire collection41// Example: ALL our examples 1-6 would trigger this (all showed stage: 'COLLSCAN')42// Real-world: If we see this firing frequently, we need indexes on those collections4344// WHERE DO THESE CONFIGURATIONS COME FROM?45// - eventTypeName: Predefined by MongoDB Atlas (see full list in Atlas documentation)46// - threshold: We choose based on our application's performance requirements47// - operator: Usually "GREATER_THAN" for performance alerts, can also be "LESS_THAN"48// 49// Complete list of available eventTypeNames:50// - QUERY_TARGETING_SCANNED_OBJECTS_PER_RETURNED (efficiency ratio)51// - QUERY_EXECUTION_TIME (query duration in ms)52// - COLLSCANS (full collection scans count)53// - OPCOUNTER_REPL_CMD, OPCOUNTER_REPL_UPDATE, etc. (operation counters)54// - HOST_DOWN, CLUSTER_MONGOS_IS_MISSING (availability alerts)55// - Many more in Atlas documentation: 56// https://www.mongodb.com/docs/atlas/reference/alert-config-settings/5758// SUMMARY: Where to use alert configurations59// 1. Atlas UI: Click through the web interface (easiest)60// 2. Atlas Admin API: Send POST request with JSON config (for automation)61// 3. Terraform: Define as resources in .tf files (infrastructure as code)62// All three methods use the same eventTypeName, threshold, and operator values6364// ============================================================================65// OPTION 2: MongoDB Profiler (Different from Alerts - Captures Query Details)66// ============================================================================67// Note: Profiling is NOT an alert system. It's a diagnostic tool that records68// slow query details to help us understand WHAT queries are problematic.69// Use profiling AFTER alerts notify us of performance issues.7071// WHERE: Run these commands in MongoDB Shell (mongosh) or our application code72// WHAT: Records detailed execution info in the system.profile collection73// WHY: Helps identify which specific queries triggered our Atlas alerts7475// Enable profiling - captures slow queries for analysis76// Level 0 = off, Level 1 = slow queries only, Level 2 = all queries (expensive!)77db.setProfilingLevel(1,{slowms:100})// Profile queries > 100ms7879// Profiling captures:80// - Full query text81// - Execution time (millis)82// - Documents examined83// - Query plan used84// - Timestamp85// This helps identify WHICH queries are slow, not just that slowness exists8687// Check profiled queries - find top 10 slowest recent queries88db.system.profile.find({89millis:{$gt:100}// Filter: only queries that took > 100ms90}).sort({91ts:-1// Sort by timestamp descending (most recent first)92}).limit(10)9394// Output example:95// {96// op: "query",97// ns: "mydb.llmsummaries",98// command: { find: "llmsummaries", filter: { "result.assignee.userId": "..." } },99// millis: 148, // Took 148ms - matches our Example 1!100// ts: ISODate("2026-02-26T10:30:00Z"),101// planSummary: "COLLSCAN", // Shows it did full collection scan102// docsExamined: 6319,103// nreturned: 3104// }105106// Advanced: Find queries with worst efficiency ratios107db.system.profile.aggregate([108{$match:{millis:{$gt:10}}},109{$project:{110ns:1,111millis:1,112docsExamined:1,113nreturned:1,114ratio:{115$cond:{116if:{$eq:["$nreturned",0]},117then:"$docsExamined",118else:{$divide:["$docsExamined","$nreturned"]}119}120}121}},122{$match:{ratio:{$gt:100}}},// Only bad efficiency123{$sort:{ratio:-1}},124{$limit:10}125])126// This would show Example 5 (6319x) at the top!
Recommended workflow: Alerts + Profiling together
1// Step 1: Set up Atlas alerts (one-time setup)2// → Alerts notify us WHEN performance degrades34// Step 2: When alert fires, enable profiling to investigate5db.setProfilingLevel(1,{slowms:100})67// Step 3: Check profiled queries to find culprits8db.system.profile.find({millis:{$gt:100}}).sort({ts:-1})910// Step 4: Use explain() on specific slow queries11db.collection.find(problematicQuery).explain("executionStats")1213// Step 5: Fix the issue (add indexes, optimize query)14db.collection.createIndex({field:1})1516// Step 6: Verify fix with explain() again17// → Should see IXSCAN instead of COLLSCAN, lower executionTimeMillis1819// Step 7: Turn off profiling (optional, to reduce overhead)20db.setProfilingLevel(0)
7.2.
Self-Hosted MongoDB alert setup
For self-hosted MongoDB, we need to set up external monitoring since Atlas's built-in alerts aren't available.